The AI Bubble Question, Explained With Python
By CodingDidi · Oct 31, 2026 · 6 min read
Alphabet's stock fell 12% on the day after a record cloud quarter, and one number explains why: free cash flow. You can calculate it for the big four AI spenders in about 25 lines of pandas.
The day a record quarter crashed a stock
On October 28, Alphabet reported revenue up 25% to $127.6B. Google Cloud grew 103%. Search query growth hit a five-year high. By any normal measure, it was a spectacular quarter.
The next day the stock fell about 12%, its worst day on record, wiping out roughly $500B in market value.
If you're learning AI, this is worth understanding, because it is the whole "AI bubble" debate in one trade. The business is growing fast. The open question is whether it grows profitably enough to pay for the machines that growth needs. The answer lives in a metric most beginner tutorials never mention.
Free cash flow, in plain English
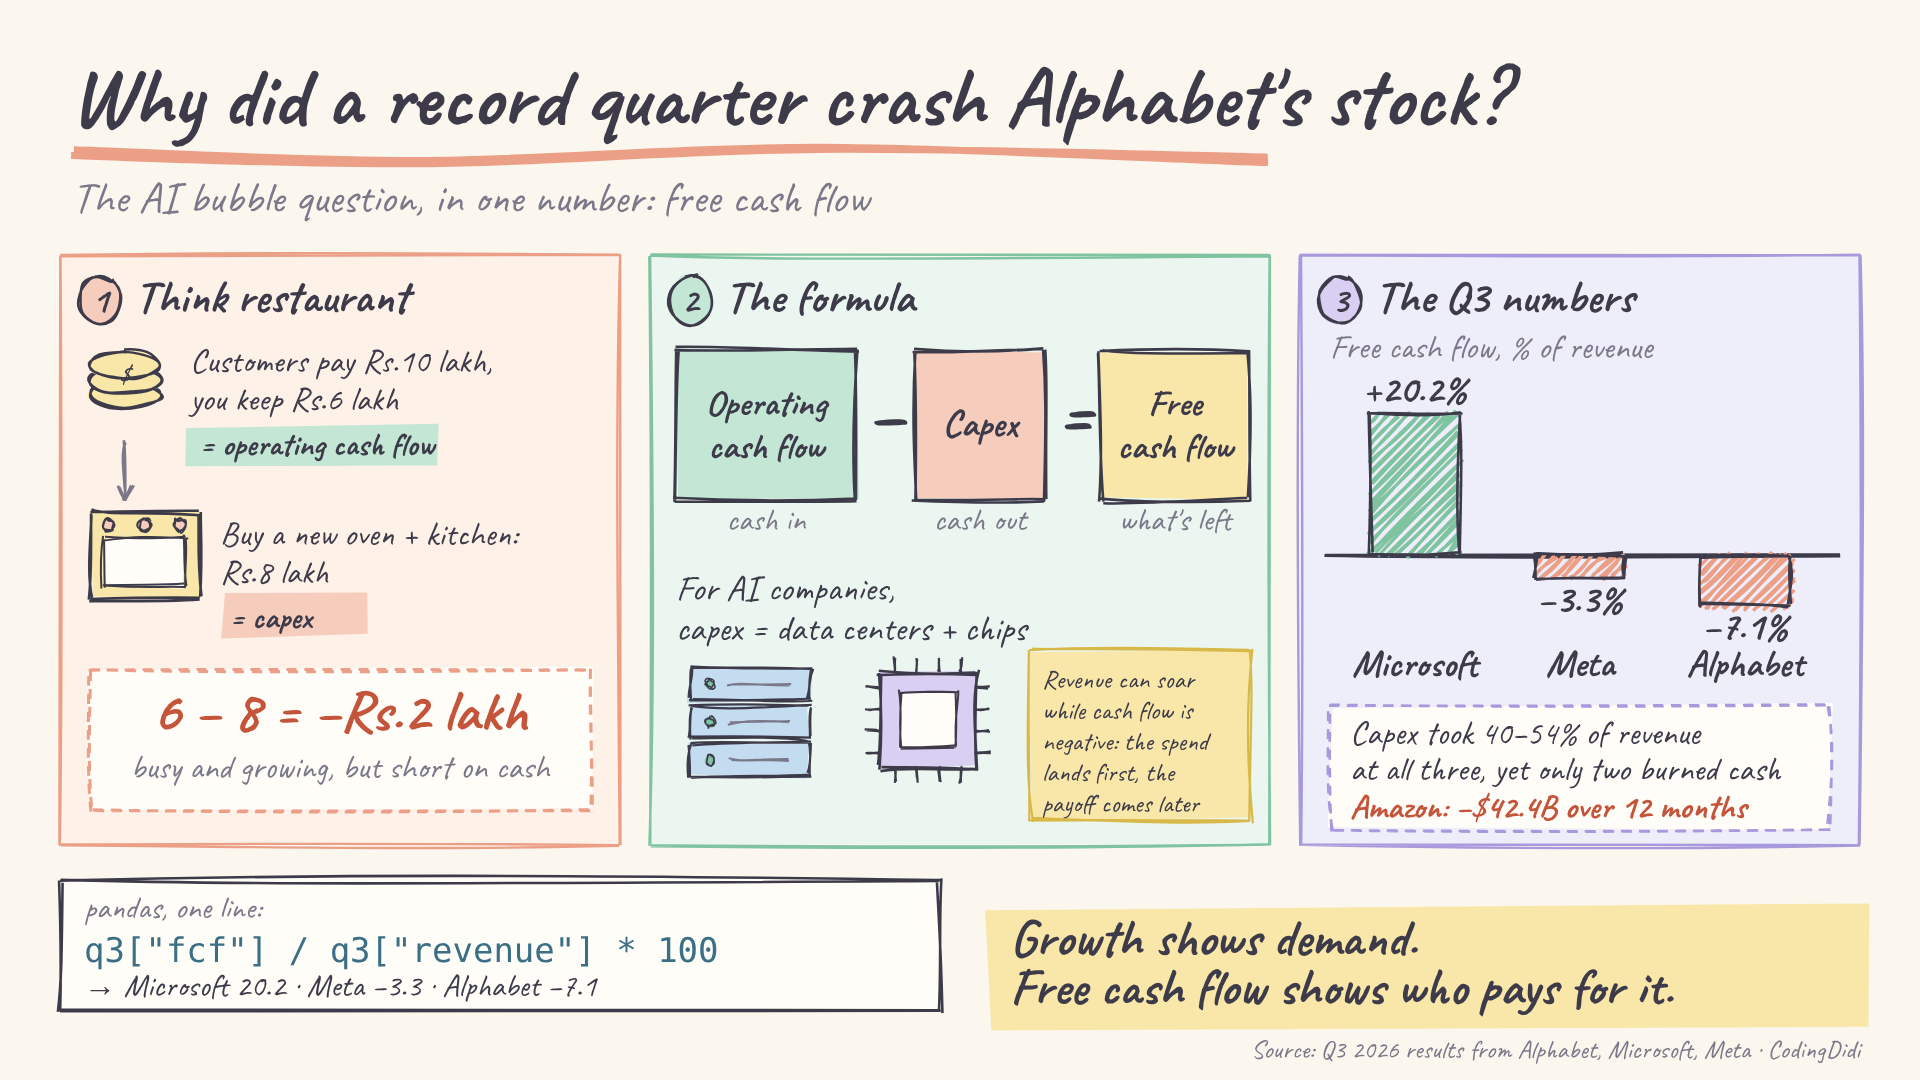
Imagine you run a restaurant. This month customers pay you ₹10 lakh. After staff and ingredients, you keep ₹6 lakh in cash. That is your operating cash flow.
Then you spend ₹8 lakh on a bigger oven and a second kitchen. That is capex (capital expenditure): money spent on things that last for years.
{Free cash flow} = {Operating cash flow} - {Capex}
Here that is 6 − 8 = −₹2 lakh. The restaurant is busy and growing, but it spent more cash than it earned, so it must cover the gap with savings, loans or new investors.
For AI companies, the "oven" is data centers and chips. Revenue can soar while free cash flow is negative, because the spending leaves the bank now and the payoff arrives later.
The data we'll use
These are the latest reported quarter (July–September 2026; Microsoft calls it fiscal Q1 FY2027), in billions of dollars.
| Company |
Revenue ($B) |
Capex ($B) |
Free cash flow ($B) |
| Alphabet |
127.6 |
51.4 |
−9.1 |
| Microsoft |
92.3 |
45.2 |
+18.6 |
| Meta |
64.6 |
34.9 |
−2.1 |
| Amazon |
201.9 |
not found |
−42.4 (last 12 months) |
Amazon only gave a trailing twelve-month free cash flow figure in the coverage I could open, so it sits apart from the quarterly numbers. Mixing periods is a classic way to fool yourself, and the code below refuses to do it.
Figures are as reported by the companies and the outlets listed under Sources. Meta's capex includes about $0.96B of finance-lease principal.
The code
Copy this into a notebook. The only library you need is pandas.
import pandas as pd

pd.set_option("display.width", 120)
pd.set_option("display.max_columns", 20)

# Latest quarter (Q3 2026), $ billions
q3 = pd.DataFrame(
    {
        "revenue": [127.6, 92.3, 64.6, 201.9],
        "capex":   [51.4, 45.2, 34.9, None],   # Amazon's quarterly capex: not found
        "fcf":     [-9.1, 18.6, -2.1, None],
    },
    index=["Alphabet", "Microsoft", "Meta", "Amazon"],
)

# Ratios make different-sized companies comparable
q3["capex_pct_revenue"] = (q3["capex"] / q3["revenue"] * 100).round(1)
q3["fcf_pct_revenue"] = (q3["fcf"] / q3["revenue"] * 100).round(1)

# NaN < 0 is False in pandas, so keep missing data missing
q3["burning_cash"] = (q3["fcf"] < 0).where(q3["fcf"].notna())

print(q3)

# 2026 full-year capex plans; Alphabet and Meta give ranges, so use midpoints
plans = pd.Series(
    {
        "Alphabet": (195 + 205) / 2,
        "Amazon": 220,
        "Microsoft": 170,
        "Meta": (135 + 145) / 2,
    },
    name="capex_2026_plan",
).sort_values(ascending=False)

print()
print(plans)
print("Total at midpoints:", plans.sum())
The two ratio lines are the heart of it. Dividing by revenue turns raw dollars into "how much of every revenue dollar goes where," which is the only fair way to compare a $65B company with a $200B one.
What the output says
I ran this exact script. Here is what it printed:
           revenue  capex   fcf  capex_pct_revenue  fcf_pct_revenue burning_cash
Alphabet     127.6   51.4  -9.1               40.3             -7.1         True
Microsoft     92.3   45.2  18.6               49.0             20.2        False
Meta          64.6   34.9  -2.1               54.0             -3.3         True
Amazon       201.9    NaN   NaN                NaN              NaN          NaN

Amazon       220.0
Alphabet     200.0
Microsoft    170.0
Meta         140.0
Name: capex_2026_plan, dtype: float64
Total at midpoints: 730.0
Three things stand out.
- Spending is enormous everywhere. Capex ran from 40% to 54% of quarterly revenue at the three companies with a clean quarterly figure.
- Only two of the three burned cash. Alphabet's free cash flow was −7.1% of revenue and Meta's −3.3%. Microsoft kept +20.2%.
- Capex alone does not predict the damage. Alphabet spent the smallest share of revenue (40.3%) yet ended up with the bigger cash hole as a percentage, so its core business covered less of the bill than Meta's did.
The plans tell the forward-looking half of the story: Amazon $220B, Alphabet about $200B, Microsoft $170B and Meta about $140B for 2026. That is $730B at midpoints, close to the "more than $740B" headline figure, which is built on slightly different assumptions.
Amazon's gap is the starkest. Its free cash flow over the last twelve months was −$42.4B, compared with +$14.8B a year earlier.
The catch: three ways this goes wrong
The code is short. The judgment around it is the hard part.
- Mixed periods. Amazon only reported a trailing twelve-month free cash flow, so putting it beside quarterly numbers would be wrong. Notice also the quiet bug the script avoids: in pandas,
NaN < 0 is False, so naive code would label Amazon "not burning cash" simply because the data is missing. Keeping missing data missing is a habit worth building early.
- Different definitions. Companies do not define capex identically. Meta's figure includes about $0.96B of finance-lease principal, and leases are not paid in cash up front. Microsoft's ratio may be flattered or inflated by the same issue, so treat these percentages as rough, not exact.
- Timing. Microsoft's capex came in below its own plan of roughly $50B for the quarter. Its CFO said third-party AI chip providers had delays that push some capacity into the first half of 2027, and it trimmed its annual forecast to $170B from $175B. So part of that +$18.6B is spending that is late, not spending that is avoided. One quarter is a snapshot, not a verdict.
What to take from this
- Growth tells you demand is real. Free cash flow tells you who is paying for it. Read both before calling anything a bubble.
- Ratios beat raw dollars when companies differ in size.
- Leave missing data missing, and label every number's period.
- Ask whether spending is late or avoided before praising or blaming a company.
Next step: when Apple (expected Nov 2) and Nvidia (expected Nov 18) report, add two rows to the DataFrame and rerun the script.
This is a data-skills exercise, not investment advice.
If you want more beginner-friendly breakdowns like this, follow along, and tell me which company you'd add next.